Surface roughness is one of the most commonly specified — and most inconveniently measured — characteristics on automotive production parts. A machined mating surface, a painted outer panel, a powder-coated bracket: each carries an Ra or Rz requirement on the engineering drawing, specified per ISO 4287. Meeting that requirement must be verified before the part ships. The traditional tool for that verification is a contact stylus profilometer, which is accurate, traceable, and slow.
At production line throughput — typically 200 to 600 parts per hour for stamped components — a contact stylus gauge is a bottleneck. It requires the part to be stationary, positioned accurately under the gauge head, and the stylus traverse takes 2 to 10 seconds per measurement trace. For 100% in-process coverage, it is impractical. This is the space where photometric stereo imaging offers a workable alternative: a non-contact method that generates an area-wide surface texture map in under one second, with outputs that correlate to the Ra and Rz values a stylus gauge would report — without stopping the part on the line.
What ISO 4287 Ra and Rz Actually Define
Ra (arithmetical mean deviation) and Rz (maximum height of profile) are both profile parameters defined in ISO 4287:1997. Ra is the arithmetic average of the absolute deviation of the surface profile from the mean line over the evaluation length. Rz is the sum of the maximum peak height and maximum valley depth within the evaluation length — it is more sensitive to isolated surface features (a single deep scratch or a prominent peak) than Ra is.
Both parameters are defined over a measurement traverse length (sampling length, evaluation length) with a specific Gaussian profile filter cutoff (λc, λs per ISO 4287/ISO 11562). This matters for optical measurement because the filter cutoffs define which spatial frequencies are included in the Ra/Rz calculation. Any optical method claiming to produce Ra/Rz-equivalent outputs must apply equivalent filtering to its measurement data — and the measurement uncertainty relative to a traceable stylus reference must be established and documented.
ISO 1302 governs how surface finish specifications are indicated on engineering drawings, including the graphical indication of the measurement direction, Ra value, and applicable manufacturing process. When using an optical method in production, the measurement parameters (spatial filter, evaluation length, measurement direction relative to lay) should match those implied by the ISO 1302 drawing indication.
How Photometric Stereo Generates a Surface Height Map
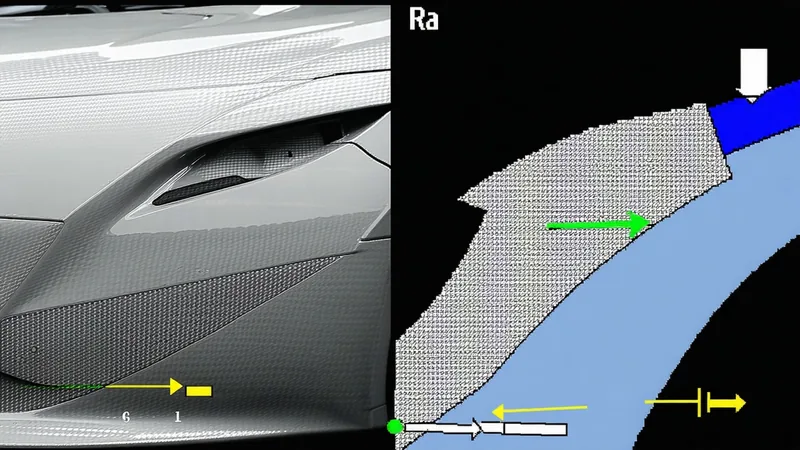
Photometric stereo is a computational imaging method that estimates the surface normal direction at every pixel by comparing the intensity response to illumination from multiple known directions. The setup consists of a fixed area-scan camera pointing at the target surface and a ring or dome illumination system with individually addressable sectors. Each sector illuminates the surface from a different azimuth and elevation angle. By capturing a sequence of images — one per active illumination sector — the algorithm computes the surface normal at each pixel via a least-squares solve over the intensity-angle relationship.
Integrating the surface normal field produces a surface height map: a pixel-resolution reconstruction of the surface topography across the camera's field of view. For a 12 MP camera at 100 mm field of view, this gives a lateral resolution of approximately 25 μm per pixel — adequate for measuring Ra values in the 0.4–10 μm range relevant for machined and coated automotive surfaces.
The height map is then filtered and processed using the same ISO 4287 profile filter parameters that a contact stylus instrument would apply. Ra and Rz values are extracted from profile traces across the surface at the specified measurement direction and evaluation length, producing outputs that can be compared directly to the drawing specification and to stylus gauge reference measurements.
What Accuracy Level is Realistic
Photometric stereo Ra/Rz measurement accuracy depends heavily on surface type and measurement geometry. For machined aluminum surfaces with Ra in the 0.8–6.3 μm range, well-calibrated photometric stereo systems typically achieve correlation within 5–10% of traceable stylus reference values. For powder-coated or painted surfaces with Ra in the 1.0–4.0 μm range and largely isotropic texture, correlation tends to be in the 8–15% range — acceptable for in-process monitoring but potentially insufficient as a standalone gauge for final shipping inspection against tight tolerances.
For surfaces with strong anisotropic texture — a turned surface with a pronounced lay direction — the measurement accuracy of the area-wide photometric reconstruction is more sensitive to the orientation of the surface height map relative to the lay. The ISO 1302 specification on the drawing should be followed: measure perpendicular to the dominant lay direction, as a stylus traverse would be oriented.
Highly reflective surfaces (bare polished steel, chrome-plated parts) are challenging for photometric stereo because specular reflection dominates over diffuse reflection at most illumination angles. For these surfaces, polarization filtering is typically required, which reduces the effective signal-to-noise ratio and increases measurement uncertainty. Consult your imaging cell design engineer before specifying photometric stereo for chrome-grade surface finishes.
A Scenario: Machined Valve Body Inspection at a Midwest Casting Supplier
Consider a plausible scenario at a growing automotive casting and machining supplier in the Ann Arbor area producing aluminum valve body housings in 2024. The part drawing specified Ra ≤ 1.6 μm on all mating port faces. Prior measurement method was a portable stylus profilometer used at first article inspection and for statistical sampling — one measurement per 50 parts, one trace per surface per measurement event.
At 100% coverage with a stylus gauge, each measurement added approximately 8 seconds per part per surface — four mating surfaces per housing, 32 seconds total per part, at a cycle time target of 45 seconds. The cycle time penalty was prohibitive. Sampling at 1-in-50 left the supplier unable to detect a surface finish degradation event that developed gradually over a 200-part run, caused by incremental tooling wear on a face mill cutter.
After deploying a photometric stereo inline cell on the machining line exit conveyor, all four mating surfaces were measured on every part in under 1.2 seconds total. The system detected the gradual Ra drift above 1.4 μm approximately 40 parts into a gradual tooling wear event — triggering a tool change alert before Ra reached the 1.6 μm drawing limit. The 100% coverage converted what had been a reactive tool change process (change tool when parts start failing final gauge) into a predictive one (change tool at a predetermined capability threshold). That change had direct impact on scrap rate at the final inspection stage.
MSA Validation: Connecting Optical Output to Stylus Reference
Before using photometric stereo Ra/Rz output as a production gauge, a measurement system analysis (MSA) study is required. Per AIAG Measurement System Analysis guidelines (4th edition), an attribute or variable gauge MSA for in-process use requires establishing repeatability (same part, same operator, multiple readings), reproducibility (same part, different operators or different measurement positions), and bias (comparison to a reference standard).
For a photometric stereo surface finish system, the MSA study should include:
- A repeatability study with a set of reference parts at multiple Ra levels across the specification range — measuring each part multiple times in sequence to quantify measurement noise.
- A correlation study comparing photometric stereo Ra/Rz outputs to stylus profilometer readings on the same reference parts, at the same measurement locations and measurement direction. The correlation coefficient and the mean bias should be documented, and the bias corrected or accounted for in the pass/fail threshold.
- A temperature stability study if the production cell experiences significant thermal variation — photometric stereo relies on stable illumination and camera geometry, which can drift with ambient temperature in an open production environment.
The completed MSA report belongs in the IQ/OQ/PQ validation package for the inspection cell and in the PPAP documentation if the vision system output is cited as a gauge in the Control Plan measurement method.
What Photometric Stereo Does Not Replace
We are not saying photometric stereo replaces all contact surface measurement. Functional surface parameters beyond Ra and Rz — Rsk (skewness), Rku (kurtosis), bearing ratio curve parameters per ISO 13565 — are more sensitive to the spatial filter accuracy of the optical reconstruction. For surfaces where these parameters are on the drawing specification, the optical method's capability for those specific parameters must be validated separately. Not all photometric stereo implementations support the full ISO 4287 parameter set, and some parameters require higher vertical resolution than a given camera and lighting setup can achieve.
In addition, photometric stereo height maps have limited capability in recessed areas or on surfaces with significant macro-curvature that varies across the field of view. For a curved automotive panel, the photometric model must include a curvature correction term, or the reference surface height map used for filter application will introduce systematic error. Cell design for curved-surface Ra measurement requires careful simulation of the surface normal direction field across the part geometry before committing to a fixed illumination geometry.
Surface finish measurement at production speed is achievable. The path there is not a black-box calibration shortcut — it is a carefully structured MSA, honest correlation to a traceable stylus reference, and a realistic acknowledgment of which surface types and parameter subsets the method handles well and which require supplemental methods.