At 30 parts per minute, a human inspector has roughly two seconds to examine each stamped bracket or injection-molded trim piece passing in front of them. That's not a complaint about workers. It's a hard physiological constraint that no amount of training can fully overcome. In our experience working with tier-1 quality teams, this constraint is where 15-30% of fine surface defects slip through undetected.
The Physiology Problem
Human visual acuity peaks in the central fovea, a zone covering roughly 2 degrees of arc. To reliably detect a 0.2mm scratch on a 200mm stamped metal panel, an inspector needs to direct foveal attention directly at that region. At line speed, that's physically impossible across the full part surface.
Research into inspection fatigue is consistent: detection performance drops measurably after 20-30 minutes of sustained attention. By the 45-minute mark, miss rates on sub-0.3mm features can increase 40% compared to fresh inspection. Tier-1 lines typically run 8-10 hour shifts with inspectors rotating every 45-60 minutes. The math is not favorable.
Short frags matter here. Two seconds. Full surface. Sub-0.2mm threshold. That combination doesn't work.
What "Fine Surface Defects" Actually Means on Tier-1 Parts
Stamped metal components present a specific set of defect signatures: micro-scratches from die wear, edge rollover from worn punch tooling, surface pitting from contaminated lubricant, and orange-peel texture from inadequate blank hold pressure. The problematic ones cluster in the 0.1-0.4mm range: large enough to fail OEM cosmetic audits but small enough to be inconsistently detected by human inspection.
Plastic injection-molded parts have a different profile. Flow marks, sink marks, and weld line visibility are the chronic culprits. Weld lines on structural brackets may be purely cosmetic in some assemblies but constitute a structural concern in others. In our tracking of PPAP submissions across tier-1 suppliers, weld line disposition decisions are among the most frequently contested items in OEM review cycles.
| Defect Type | Typical Size Range | Material | Manual Detection Rate |
|---|---|---|---|
| Micro-scratch (die wear) | 0.1-0.3mm width | Stamped steel / aluminum | 60-75% |
| Edge rollover | 0.2-0.5mm radius | Stamped steel | 70-80% |
| Surface pitting | 0.15-0.4mm dia. | Stamped aluminum | 55-70% |
| Weld line visibility | 0.3-1.0mm | Injection-molded plastic | 65-80% |
| Sink mark | 0.2-0.8mm depth | Injection-molded plastic | 50-70% |
These detection rates assume reasonable lighting and an attentive inspector. Real-world conditions drive the numbers lower.
The SCAR Cost Reality
When a defect escapes to a Tier-1 assembly line or, worse, to an OEM final assembly, the consequences go well beyond a rejected shipment. Supplier Corrective Action Requests (SCARs) carry direct and indirect costs that most quality cost accounting systems understate.
Direct SCAR costs at major OEMs run $8,000 to $45,000 per event. That range covers sorting labor, expediting replacement parts, administrative processing, and any production downtime charged back to the supplier. A single SCAR on a high-volume stamped bracket program can wipe out an entire week of margin.
Fact: The indirect costs are usually worse. Two or three SCARs in a 12-month window triggers enhanced surveillance status. Enhanced surveillance means your facility receives unannounced audits, quality engineers on-site during production, and preferential routing of new business away from your plant during resourcing decisions. We've seen suppliers spend $200,000 in quality engineering time and executive attention to exit enhanced surveillance. That cost never appears in a SCAR count.
The 100 PPM OEM Target: What It Demands From Your Inspection Process
Major automotive OEMs publish incoming quality targets in the range of 50-100 defective parts per million. That's 0.005-0.010% of shipped units. For a supplier shipping 500,000 stamped brackets per month, a 100 PPM target means no more than 50 defective parts reaching the customer.
Here's the thing: if your process produces defects at a natural rate of 500 PPM (a reasonable starting estimate for many stamping operations), you need your inspection system to catch 90% of them before they ship. Manual inspection at line speed demonstrably does not achieve 90% detection for sub-0.3mm features. Honestly, 70-80% is more realistic under production conditions, and that math doesn't close the gap.
To hit 100 PPM customer-facing with a 500 PPM process defect rate, you need effective detection above 99.5%. That's the real target. It's not achievable with human inspection alone at full production speed.
Why Automation Outperforms on the Production Line
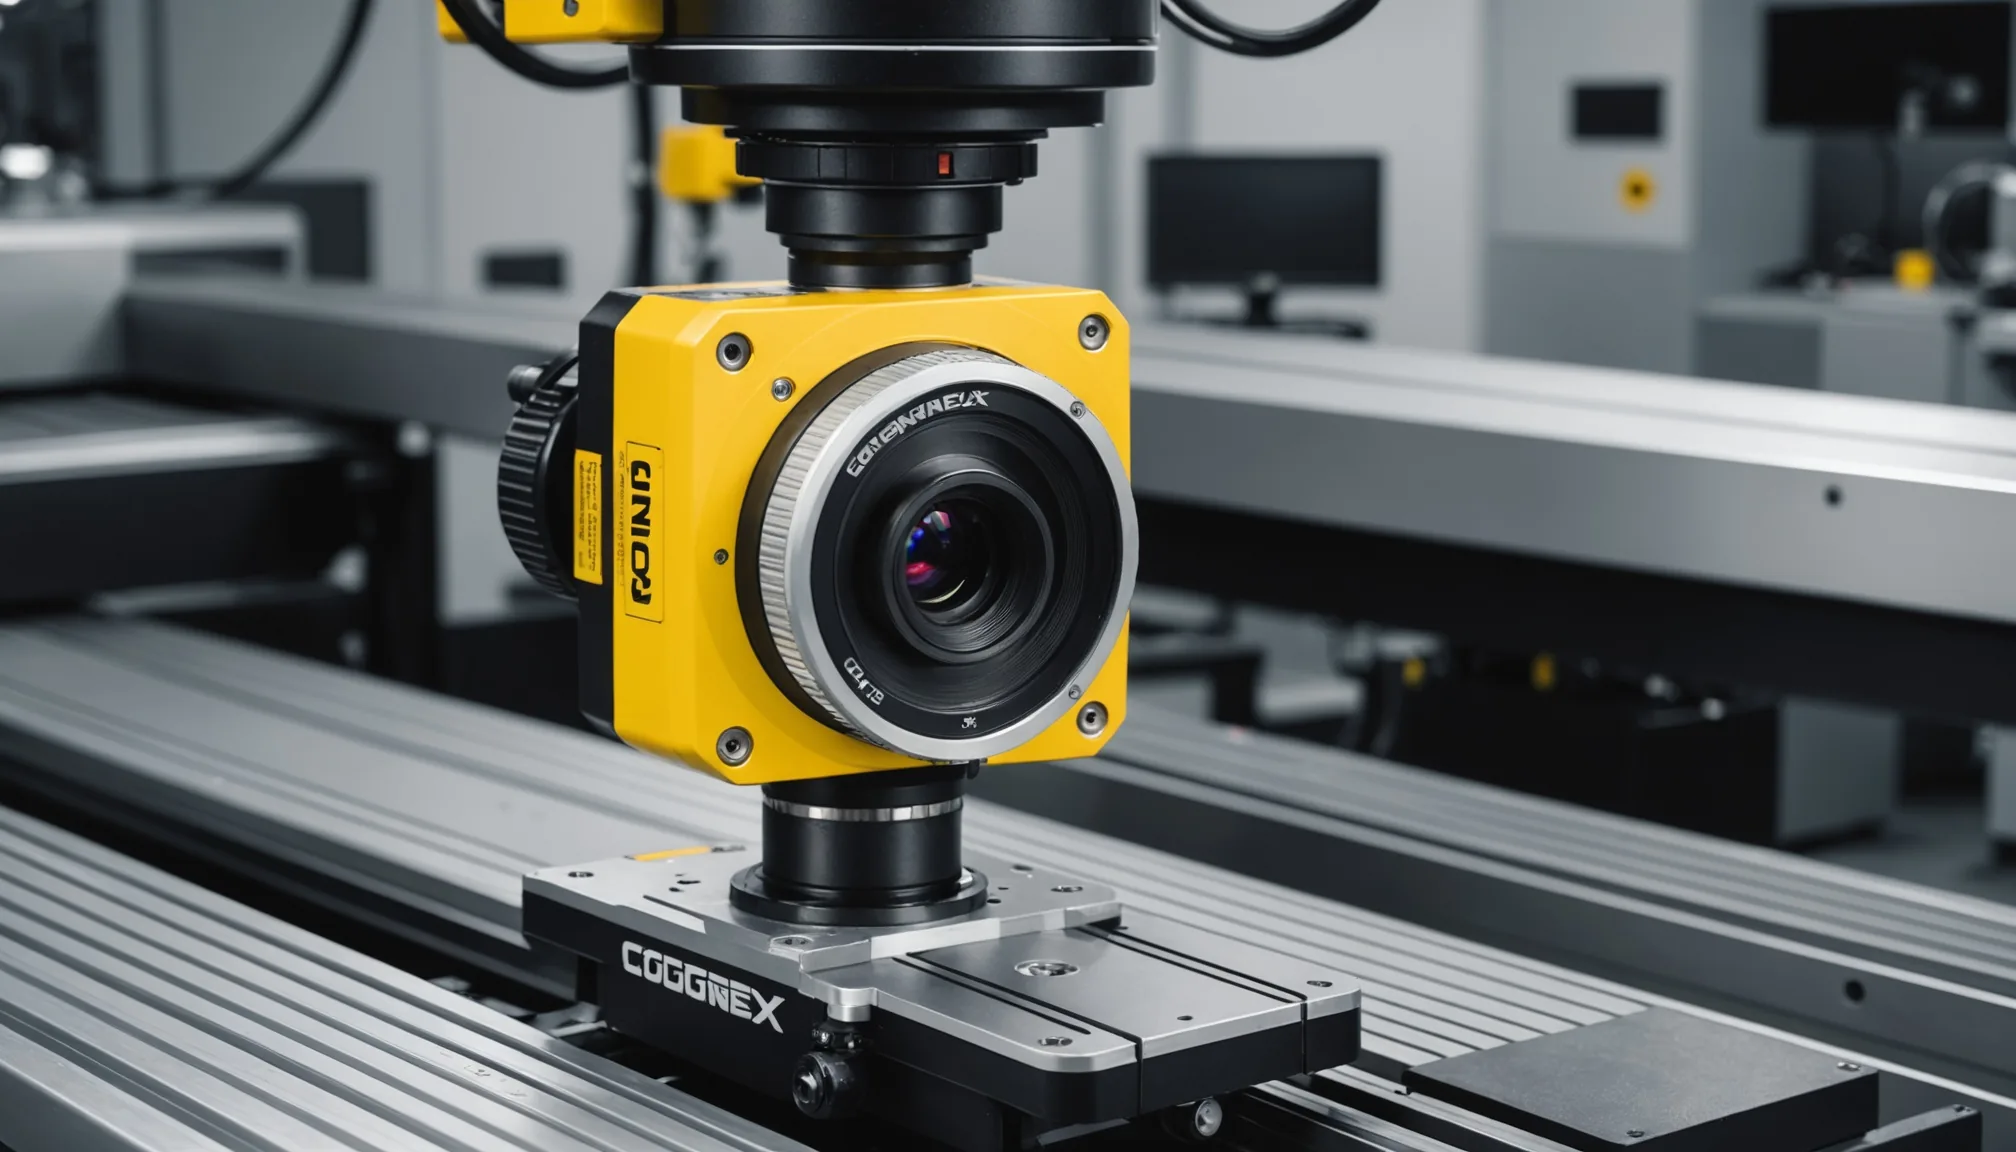
Computer vision systems don't fatigue after 30 minutes. They apply the same inspection algorithm to part 1 and part 50,000 with no degradation. For stamped metal surfaces, structured light imaging combined with trained defect classifiers consistently achieves detection rates above 95% for features down to 0.15mm. For injection-molded plastics, high-resolution area-scan cameras with controlled diffuse illumination resolve sink marks and weld lines that human vision misses under standard inspection booth lighting.
The throughput argument matters too. A single automated inspection station can process 60+ parts per minute with full-surface coverage. That's not 2 seconds of attention on critical zones. It's 100% surface scan, every part, every cycle.
In our data from deployments on tier-1 stamping lines, false positive rates (good parts rejected) typically stabilize below 0.8% after model calibration, which is acceptable for high-volume programs. False negatives, the escapes, drop to under 1% for trained defect classes. That's a fundamentally different risk profile than manual inspection.
The Transition Isn't Purely Technical
One point that doesn't get enough attention in supplier quality discussions: automating visual inspection changes your quality data fundamentally. Manual inspection produces a pass/fail count. Automated inspection produces a timestamped defect map for every part, with location, size, and classification.
That data feeds directly into SPC, die wear monitoring, and preventive maintenance scheduling in ways that manual inspection records never could. A stamping plant that can correlate micro-scratch occurrence frequency to press stroke count gains a predictive maintenance signal. That's a capability shift, not just a detection improvement.
The conversation with OEM supplier quality engineers also changes. When you can show a PPAP package that includes automated inspection coverage data, detection confidence intervals, and a full traceability record per production lot, you're having a different conversation than the supplier who can only produce an inspector sign-off sheet.
Setting a Realistic Improvement Target
If you're currently running manual visual inspection on a stamped metal or plastic injection line and your customer-facing defect rate is above 150 PPM, the data suggests automated inspection is likely the most direct path to sustainable improvement. Not because your inspectors aren't skilled. Because the physics of 30 parts per minute and 0.2mm thresholds don't leave enough margin for human detection.
Start with a measurement baseline: 100% outgoing inspection for 30 days with detailed defect logging by type, location, and shift. That data will tell you which defect classes drive your escape rate. Build the automation case around those specific classes. Don't specify a general-purpose system; specify a system validated on your actual part geometries and your highest-frequency defect signatures.
The 100 PPM target is achievable. But it requires an honest accounting of what manual inspection can and cannot do at production line speed.
Want to see detection rate benchmarks for your specific part type? Contact us to discuss how Qcvisionly approaches escape rate reduction on tier-1 stamping and injection molding programs.